Chapter 6: GIS data collection and editing
Geospatial Data is a defining characteristic of any GIS project, and data collection and editing is one of its key components. Similarly, data editing is often required. The collection and editing are time-consuming, tedious, and expensive processes and can account for up to 50% of the total project cost. The GIS data collection may reach up to 85% of the project cost if the staffing costs are excluded from the project costs. In short, geospatial data collection data is a significant task of any GIS project which would require thorough planning and establishing user requirements. Geospatial data is divided into two main categories, i.e., Vector Data and Raster Data, as explained in Chapter 3.
6.1 GIS Data Collection Tools and Techniques
Ever increasing use of digital devices is resulting in a huge amount of digital data being created daily. It was estimated that about 100 zettabytes (ZB) of digital data were created in 2022, and it is expected to be doubled by 2025. However, not all the digital data being created/collected is useful to a GIS project. The challenge is finding the right data in the right format. GIS data collection always starts with the search of data available through open data sources or data available in the archives.
However, it does not eliminate the need to go out in the field for collection of the required geospatial data. Different data collection tools and techniques can be used for this purpose.
6.1.1 Land Surveying
Traditional land surveying techniques are the most accurate method for geospatial data collection. It is the method of choice when it comes to measuring property lines and features requiring high precision such as buildings, bridges, and monuments. However, it is not the most efficient or cost-effective method of geospatial data collection. Coordinates of an unknown point are measured by measuring distance and direction from a point of known coordinates. Total station is a commonly used device for land surveying. It comprises of an electronic theodolite and electronic distance measurement device (EDM). The theodolite is used to measure the angles in both the horizontal and vertical planes, whereas the EDM records the distance from the total station to the point of interest. GPS is also embedded in the modern total stations to improve surveying accuracies and to record coordinates of unseen points.
6.1.2 Global Navigation Satellite System (GNSS)
Traditional land surveying techniques are the most accurate method for geospatial data collection. However, most of land surveying techniques require the surveying equipment to be located within the line-of-site of each other. This brings an additional challenge to the land surveying crew, especially in areas where terrain is difficult, and accessibility poses safety concerns. Global Navigation Satellite System (GNSS) provide an alternative solution to the traditional land surveying techniques. GNSS is a constellation of various space-based radio navigation systems. Currently four international navigation systems including GPS (American), GLONASS (Russian), Galileo (European), and BeiDou (Chinees) are part of GNSS. Each GNSS system consists of several satellites constantly revolving around the Earth providing positional information day and night in all weather conditions. The GNSS receiver communicates with these satellites to determine its location and speed if moving. The position of the receiver is calculated through a trilateration process. A minimum of four GNSS satellites should always be in the visible range of the receiver. Since satellites are orbiting around the globe at a very high speed, the number of satellites in the visible range of the receiver are continuously changing; while some of the satellites are moving away from the range, the others may be entering in. More satellites in the visible range of the receiver can increase positional accuracies. Any physical or electromagnetic obstruction within the line of site between the satellite and the receiver can increase position inaccuracies. Thus, GNSS receivers will not provide accurate information or any information under three canopies: in tunnels, covered areas, or in the near vicinity of tall structures such as buildings. Highly accurate real time positional information is sensitive for security reasons. Thus, each GNSS system introduces random errors to the positional information. These random errors are continuously changing. However, these errors can be rectified through post-processing of the GNSS data. The positional accuracies can also be improved through Real Time Kinematics (RTK) which involve a base station with known position and a rover receiver to find coordinates at an unknown location. The data received by the base station is used to rectify the errors in data received by the rover receiver. However, a radio link between the base station and the rover receiver is required for this purpose. RTK GNSS can provide highly accurate survey grade real time positional information. It also provides a low-cost and robust solution to acquire positional information even in challenging environments, such as rugged terrain. Mapping grade data can be acquired without post-processing or RTK GNSS receiver. GNSS receivers are usually divided into three main categories, i.e., recreational, mapping, and surveying. The surveying grade GNSS receivers are highly accurate and of course are expensive as compared with the recreational or mapping grade GNSS receivers.
6.1.3 Mobile Apps for Field Data Collection.
The mobile technologies are evolving at a tremendous pace. The advancements in the smart phones and tablets have allowed the development of several applications for field data collection and mapping. It is a convenient alternative of expensive field data collection equipment. These apps can work with online or offline maps and can collect data at acceptable accuracies for most of the GIS projects. However, expensive, and more accurate equipment can be used where higher data accuracies are required. Some of the commonly used mobile data collection apps may include Esri’s Collector and Survey123, QField, Mergin Maps, Fulcrum, and GIS cloud.
6.1.3.1 Collector and Survey123
Collector and Survey123 were developed by Esri and can work together for GIS field data collection. The Collector app is mainly focused in collecting vector data sets (points, lines, and polygons), whereas Survey123 is form-centric which allows users to collect the data in tabular format. The data collected through these apps can easily be integrated with ArcGIS Online.
6.1.3.2 QField
It is an open-source alternative of Esri’s Collector and Survey123 which works well with Android devices. It allows users to set up forms, take photos, and view custom maps for field use. The data collected through QField can be synchronized with QGIS through QField Sync plugin.
6.1.3.3 Mergin Maps
Another open-source app which provides an intuitive way of collecting field data through mobile phone or tablet. It is an easy-to-use app requiring minimum or no training. The interface is simple but offers powerful features for capturing vector data which can be overlaid on background maps. It allows the attachment of external GPS to improve data capturing accuracies. It also allows geotagging of photos and barcode scanning and can work equally well with Android and iOS (iPhone operating System) platforms. The data captured though Mergin Maps can be opened in most of the mapping software including QGIS and ArcGIS.
6.1.3.4 Fulcrum
It is one of the slickest apps for mobile field data capturing which uses Google Maps as background maps. Since it is powered by Google Maps, the users have access to millions of geolocations which are updated frequently. It offers intuitive editing, filtering, importing, and exporting capabilities. Thus, the Fulcrum dashboard oversees all field activities. However, it is not an open-source app and user has to subscribe for its use.
6.1.3.5 GIS Cloud
It is a cloud- (subscription) based app for field data collection with map editing capabilities. The pricing is based on its usage. The base price is for only data collection features but can increase with map editing capabilities. It also allows users to work with offline maps which is a great feature in remote locations where mobile network is not available.
6.1.4 Citizen-Centric Data Collection
The evolution of world wide web technologies has enabled citizens to participate in geospatial data collection. Most of this data is collected on volunteer basis and in some cases the participants even do not realize that they are collecting a valuable geospatial data. Many of us have shared the location of our business or point of interest. Many of us are uploading their pictures with the location where the picture was taken. All these contributions are valuable and can be used as a GIS resource. Smartphones are playing an important role in citizen-centric data collection. Almost everyone with a smartphone can share, capture, or collect geospatial information. Volunteered Geographic Information (VGI) is on the rise. Smartphone applications usually ask for the permission of user to show their location information. This location information is used to identify the places visited by the user. User experience about a particular business or location are all part of VGI. These surveys can be used to add important attribute information with the location. People report unusual activities such as accidents and traffic traps on a regular basis using their smartphones. Similarly, many organizations have developed and enabled location-based services (LBS). Smart cities are encouraging their citizens to report location of areas of concerns such as potholes, water pipe leakages, dead animals so that city management can take necessary action. LBS also allows citizens to view the location of essential services such as public transport and its expected arrival time to a specific stop.
6.1.5 Geo-Visualization
Digital interactive maps hosted on the worldwide web such as Google Maps, OpenStreetMap, Map Quest, etc., are valuable resources of geospatial data. Some of these resources can be used as 3D representation of the Earth in high resolution. These maps allow users to interact with the map to extract desired information and to draw their own conclusions or results.
6.1.6 Raster to Vector Conversion
Remote sensing is a discipline within itself which can provide a wealth of geospatial information. The data acquired through sensors mounted on satellites and aerial platforms are all part of remote sensing. The sensors mounted on Remotely Piloted Aircraft Systems (RPAS) acquire data over a small area in a short time. It is considered as one of the most efficient and cost-effective ways for geospatial data collection. LiDAR point cloud data provide reliable and accurate information for digital elevation models (DEM) and digital surface models (DSM). Remote sensing data has been used for several applications and has been proven to be an important source of geospatial data and information. Though raster data can be used as a layer in GIS, the information extracted from these images is usually converted into vector format before using it in GIS. This information may include different thematic layers which can be used for further analysis and mapping purposes.
An enormous amount of geospatial information is also available in the form of traditional paper-based maps. This information can be extracted through digitization of the map. While digitising tables are commonly used for this purpose, scanned copies of the paper maps can be used for on-screen digitization.
6.2 GIS data accuracy
GIS data is not perfect and like any other data, it has intrinsic inaccuracies which can propagate during analysis or processing of the data. It is essential to understand these inaccuracies to achieve better results and to meet GIS project requirements. GIS data is collected through various sources which have intrinsic scale at which the data was collected. Sometimes it is referred to as a source scale. Digital maps can be displayed at different map scales, and the information displayed on a map can change with respect to the display scale. Small scale maps can display more details, but a smaller area will be displayed on the screen. In principle, a digital map does not have any scale as it changes with the zooming level. However, there is a limit imposed by the data collection sources (source scale) and methodologies beyond which level of details cannot be added regardless of the change in the zooming level. Sometimes, the source scale is also referred to as data resolution which is the smallest difference between adjacent positions where data was collected. The data resolution or data source scale introduce inherent errors in the data which cannot be rectified in the existing data. Information extracted from raster data is limited by its spatial resolution which is determined by its pixel size. For example, LANDSAT 8 data have a spatial resolution of 30m. Any information extracted from LANDSAT 8 data may have 30 m inherent errors. However, these errors may propagate during different data analysis/processing steps. The source scale or the data resolution determines its accuracy. Usually, data accuracies are divided into two categories, i.e., Positional Accuracy and Geometric Accuracy. However, highly accurate data can be very difficult and costly to acquire, compile, or produce. The acceptable level of accuracy depends upon the specific application of the project and can greatly vary from project to project.
6.2.1 Positional Accuracy
The quantifiable difference between the position of a feature in the maps or data set and its actual location in the real world measures the positional accuracy of the feature. Data source scale, projection, and datum all play important roles in the positional accuracy of a feature. For example, the data digitized from a 1:50,000 topographic map sheet may have inherent positional accuracy of about 10 m, whereas the data digitized from 1:100,000 topographic maps may have relative positional accuracy of 100 m. Data collected through mapping grade GPS may have a positional accuracy of 2 m. Thus, it is quite possible that the data collected from various sources having different positional accuracies and may not match properly and may add analysis difficulties.
Data types and data processing may also add positional inaccuracies. For example, variations in soil types may not have exact boundaries. Similarly, the results of interpolation are highly dependent on the interpretation technique used. In some cases, cartographers may slightly move an object from its original position to accommodate other features or to improve map readability.
Symbol size also influences the data accuracy and its precision. Typically, highway is shown using a line and 3 points whereas local roads are showing using 1-point thick lines on a map at 1:100,000 scale. The line thickness will introduce inaccuracies in the data as shown below.
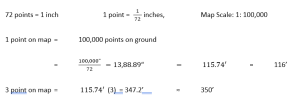
These calculations show that highways shown using a 3-point line thickness on a map at 1:100,000 scale may have measurement uncertainties of 350 feet. Assume a line of 0.5 mm is used for linear feature. Uncertainties associated with 0.5 mm line thickness at various scales are as shown below:
1:5,000 2.5 m
1:24,000 12 m
1:100,000 50 m
1: 1,000,000 500 m
6.2.2 Geometric Accuracy
The quantifiable difference between the geometry of a feature in the maps or data set and its actual geometry in the real world measures the geometric accuracy of the feature. These differences may arise from the source scale and generalization of a feature. The errors induced during digitization of the paper-based maps can also contribute to the geometric errors of the data. Images acquired through sensors mounted on the satellite and/or aerial platforms are valuable resources of geospatial data. Several landcover features can be extracted from satellite and/or RPAS images. However, tilt and role of the imaging system can introduce geometric errors. These errors are also subject to the movement of the platform and the ever-changing topography of the area. These images can be orthorectified to improve its geometry.
6.2.3 Attribute Accuracy
Power of GIS lies with the attributes attached with the geospatial features. These features provide the basis of data analysis for any GIS project. However, every field of an attribute table has a specific data type. These fields may hold object identifier, numbers, text, date, and geometry. Numbers can be entered as numbers or, in some cases, text. Typically, highways are represented by integers but usually entered as text in GIS attribute tables. GIS technologist or technicians entering values in the attribute table must be careful while choosing data type of the field. Similarly, mathematical operation can only be performed if data is entered as numbers (integer, float, or double). Mismatched data type for a numeric data field can also lead to data analysis errors. The text can be enters using all upper case, all lower case, abbreviations (Hwy vs. Highway) and so on. Mismatched names in a text field are a commonly seen problem in data entered by different professionals or agencies. Mismatched data type of the similar features may cause data analysis difficulties or errors.
6.2.4 Temporal Accuracy
The Earth and its environment are not static in time and keeps on changing over time. So do maps. Some phenomena change very quickly while others may change gradually. The weather system changes frequently. Land-use/Land-cover (LULC) information changes gradually but can also change quickly because of natural disasters such as floods, landslides, or fires. Political and municipal boundaries are also subject to change. The information which may be accurate at one point in time may not be accurate in another time. Thus, every map should have its date of creation indicating that the information presented on the map was accurate at that time. Similarly, geospatial data should also have its date of collection. Cartographers must be careful and choose data as per project requirements. They should also be mindful about the data updates if any. Some departments regularly update their geospatial data sets. However, the historical data or data acquired in the past is very useful in monitoring temporal changes. This data can be used to assess changes caused by natural or human activities.
6.2.5 Processing Accuracy
The geospatial data need to be processed to extract more information. Hotspot analysis, pattern analysis, and trend analysis all require statistical models to be used in processing and analysis of the geospatial data. Every statistical or mathematical model has its own limitations and can introduce errors. These errors can propagate at various stages of data analysis/processing. The researchers should be aware of the limitation and the errors caused by the processing/analysis steps used in GIS projects. All analysis/processing steps used in any GIS projects should be discussed and justified in the final report of the project.
6.3 GIS data precision
Precision of GIS data refers to the exact description of the data. It determines the closeness of the measured values. The measured values can be accurate but not precise and, similarly, can be precise but not accurate. It may also involve whether the data is recorded as an integer, float, or double. The number of decimal points in the data are used to determine its precision. The concept of precision and accuracy is typically represented by infographic as shown in Figure 15.
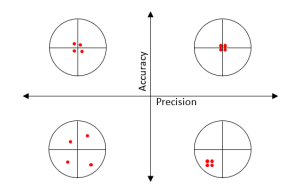
Figure 17: Precision and Accuracy
6.4 GIS Data Quality Inspection
Geospatial data sets are rarely perfect. The quality of a data set is defined as a degree of its acceptance for the intended use. Some data sets may be useful for one application or project and may not be useful for another application or project. It is the ethical and legal responsibility of professionals to determine if the data set is suitable for its intended use. Thus, data quality inspection should be the first step of any GIS project. Geospatial data quality is usually assessed at two levels. First level of assessment is performed at data capturing level and the second level of assessment is performed at data usage level. Geospatial data quality is usually assessed based on the following four quality issues. These quality issues should normally be discussed in the metadata associated with the geospatial data.
- Lineage
- Logical Consistency
- Completeness
- Accuracy (Positional, Geometric, Attribute, Temporal, and Classification)
6.4.1 Lineage
Data lineages describe the original source of the geospatial data and all the steps involved in its transformation from start to finish. It also provides information about all the processing steps involved in developing the final data product indicating potential data errors. The lineage must provide information about the control points with sufficient details to allow data recovery and validation. Thus, lineage can be used for data accuracy validation. Digital data is usually hosted on platform and can be delivered through various means. It can be downloaded directly from the host machine or copied to a storage device for its delivery to the client. The data delivery mechanism is an important component of data lineage.
6.4.2 Logical Consistency
Logical consistency requires topologically correct data to validate the relationship of the geospatial data with the real world and its environment. Compliance of the topological rules is essential for any data analysis. Overlapping polygons, undershoot or overshoots roads, missing nodes at the road intersections all add analysis difficulties. One-way streets must be indicated appropriately in the attribute table to facilitate network analysis. Similarly, stream segments must be in the corresponding floodplain indicating waterflow in the right direction.
6.4.3 Completeness
Data completeness measures the totality of the features and their attributes in the geospatial data. The selection criterion of features and mapping rules followed during data collection are essential parts of data completeness. Degree of generalization is also a part of data completeness as it defines the smallest data unit included in the data sets. However, completeness is subject to the project requirements. Even highly generalised databases can be considered complete if they contain all the required objects for a specific application or project. Thus, the data completeness determines fitness of the data for its use for a specific project. The completeness does not only require the desired features to be included in the datasets but also require the desired attributes in the dataset. Thus, the dataset needs to be complete over space, time, and theme.
6.4.4 Accuracy
There could be several sources of data errors in a geospatial dataset as discussed earlier. Identification and qualification of data errors is an essential component of quality inspection. These errors are usually expressed in terms of Root Mean Square (RMS) value. It indicates the average accuracy in terms of map units. However, the number of data control points for accuracy assessment should be greater than the requirements of data quality standards. American Society of Photogrammetry and Remote Sensing (ASPRS) developed data accuracy standards which require geospatial data to be accurate at 95% confidence level as a function of RMS errors. These errors should be reported in the metadata. It is generally assumed that the data provided by the government organizations and other credible data sources conform to the data quality standards.
6.5 GIS vector data topology and topological rules
A spatial relationship between adjacent features in GIS is expressed by their topology. Topology is useful in defining spatial relationship like adjacency, connectivity, overlap, and intersection. The topology is implemented through a set of rules defining how features may share space and geometry. It is one of the key requirements of data management, integrity, and quality. It allows features to share their geometry with other adjacent features. Edge, face, and node are three key topological parameters used to define a spatial relationship between features. Typically, point features can be coincident with line features. Line features can share segments and/or endpoints with other line features or share endpoint vertices with point features. Similarly, polygon features can share their boundaries or can be nested within another polygon. Vector feature topology can broadly be divided into six categories.
- Point Topology: Point features can share vertices with line feature.
- Node Topology: Line features can share endpoints vertices with point features.
- Arc-Node Topology: Line features can share endpoints.
- Route Topology: Line features can share segments with other line features.
- Polygon Topology: Area features can share boundaries.
- Region Topology: Area features can overlap with other area features.
It is difficult to avoid topological errors during the geospatial data collection process; however, it can generally be improved by defining cluster tolerance and rank of the features. Cluster tolerance specifies a distance at which all vertices or boundaries are considered coincident. The vertices or boundaries within cluster tolerance will snap to each other. However, the probability of the snapping feature is determined by its rank. A feature with lower rank will move to snap to the feature with higher rank. The features with same rank will move equally to snap with each other. The features will not collapse if they are separated by a distance larger than the cluster tolerance.
Geospatial data collected from different sources having similar features may not fully integrate because of varying topology of the features. Census boundaries may not match with the municipal boundaries if collected by different organizations. These topological errors can be rectified by using different topological rules. Esri has developed an excellent poster explaining different geodatabase topology rules which can be downloaded (in PDF format) from: https://webhelp.esri.com/arcgisserver/9.3.1/java/geodatabases/topology_rules_poster.pdf
6.6 Data editing tools and techniques
GIS data may require creation of a feature and/or its editing. Almost all the mapping and geospatial data analysis software facilitate the creation and editing of features. ArcGIS Pro has a table to allow the use of various functions for this purpose. It includes create, modify, edit vertices, reshape, merge, and split tools. The users can also create new features in a selected layer by using the “Create” tab on the “Edit” ribbon. The feature to be edited needs to be selected before starting editing. Some of the commonly used editing tools are displayed in the “Tools” window of the “Edit” tab; however, more tools can be accessed by clicking the down arrow of the “Tools” window.
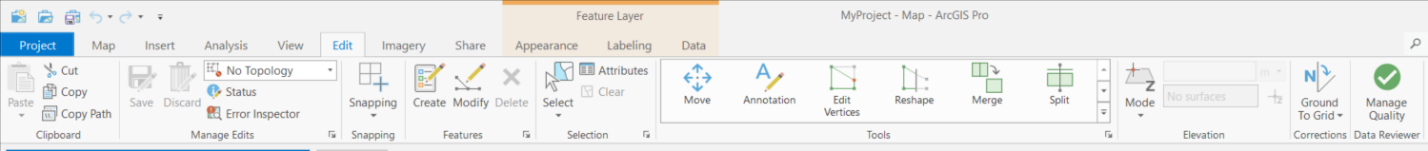
Figure 18: ArcGIS Pro Data editing Tools
Some of the commonly used editing tools may include:
MOVE: Allows users to move a feature from one location to a new location without any change in its shape or modification of vertices.
ROTATE: Allows users to spin a feature in a circular motion from a central pivot point.
SCALE: Allows users to resize a feature uniformly without changing its shape.
EDIT VERTICES: Allows users to add, delete, or move vertices of an existing feature to reshape it.
RESHAPE: Allows users to update vertices of an existing feature by using a line segment.
REPLACE: Allows users to exchange geometry of feature to another feature.
EXTEND: Allows users to increase the length of a feature
https://gisgeography.com/gis-editing-tools/
6.7 Data conversion tools and techniques
GIS has proven to be a powerful tool for spatial data handling. The spatial data can be captured using a wide variety of techniques and sources. Variations in data capturing techniques and tools bring a unique data integration challenge as the data may be captured and saved in different data formats. Geospatial data might have been collected using a different coordinate system, projection system, and datum. As discussed earlier, the accuracy of the geospatial data depends upon the inherent scale of the data. All the information about the coordinate system, projection system, datum, scale, and accuracies can be obtained from the metadata. Most of the historical surveying data is available in AutoCAD format. This data needs to be converted into the working format of the software being used for the project. SHP file format is commonly used in GIS environment. Most of the software allow data conversion from one format to the other format. Some of the commonly used data conversion tools are given below:
CAD Toolset
As discussed earlier, most of the geospatial and land surveying data might have been collected and saved in CAD traditional formats. The CAD toolset allows CAD dataset to be added in GIS environment as a feature layer or a group layer or a geodatabase which may only be a read-only feature layer. This layer can be exported in the desired GIS format. A coordinate system can be assigned to the exported layer to make it compatible with the other map layers. However, if the input CAD file contains projection information, it may automatically populate the spatial reference parameters with the projection information.
GPS receiver is a commonly used device for collection of geospatial data. It saves waypoints and routes in a specific format using WGS 1984 coordinate system and are saved as latitude-longitude pairing including elevation information. The GPS toolset allows users to convert GPS points or lines to the point or polyline feature class. The converted point feature class may store the elevation information; however, the converted polyline feature class may not store the elevation information. Similarly, the tool also allows points or polyline to be converted into GPX format. The converted features will use WGS84 projection system even if the input features are captured in another projection system.
Graphic layers in a GIS environment are used as a container for the graphic elements. These graphic elements can play an important role in defining area of interest. These graphic elements can be converted into a SHP file using the graphic toolset. The toolset provides the option of converting “graphic to feature” or “feature to graphic”. The “graphic to feature” option will only allow users to convert one type of graphic elements into the corresponding map layer. The “Text” elements will be converted into annotation. The toolset will automatically delete the graphic element if the “Delete Graphic after Conversion” option is selected while using the tool.
Provided by Google, KML is one of most popular formats for geospatial data sharing across the internet and for use in online mapping applications. WGS84 is its default projection system. It can be composed of point, line, and polygon features including their attribute information. It can also be used for raster imagery. A single KML file can contain different geometries (point, line, and polygon) as well as imagery which is a unique characteristic of a KML file whereas a SHP file can have only type of geometry as one layer. The KML toolset has three main features. It allows KML file to be converted into a map layer, a map layer to KML, and the entire map to KML. Each feature class created will have the same attributes as the input file. The point features of KML file, when converted into a layer, can also contain its symbology.
The Light Detection and Ranging (LiDAR) can be mounted on Remotely Piloted Aircraft System (RPAS) and other aerial platforms. It shoots laser pulses towards the ground and records return signals (echoes). Terrestrial Laser Scanner (TLS) is a ground-based equipment which works the same way. Simultaneous Localisation and Mapping or Synchronised Localisation and Mapping (SLAM) also uses similar techniques to collect geospatial data. The use of these technologies has tremendously increased in recent years. The collected data is usually called point cloud data and it contains millions of point information gathered through returns or echoes. This data is usually recorded in LAS format and may need to be converted into formats commonly used in GIS environment for further analysis. Point cloud Toolset allows LAS dataset to be converted to Raster, and it also converts point cloud to corresponding raster image. Elevation values stored in the LAS file or in the point cloud are used to create the output raster image. The toolset uses data interpolation to fill void cells so that the output raster is smooth.
Media Attributions
- Screenshot 2025-10-20 093749
- Screenshot 2025-10-20 093932
