Chapter 7: GIS data analysis and information extraction
Sometimes GIS can be mistaken as a tool to create digital maps; however, data analysis and geoinformatics capabilities of GIS differentiate it from digital cartography. It does not only allow users to capture and store data in digital format, but it also allows manipulation and analysis of the geospatial data. Advancements of remote sensing technologies have allowed the capturing of global data to build comprehensive inventory of the global/national spatial data infrastructure. This led to the increased use of data analysis and information extraction tools in a GIS environment. Some of the commonly used data analysis and information extraction techniques/tools are discussed below.
7.1 Data Section Tools and Techniques
Geospatial data sets are growing, and volume of geospatial data is ever increasing. Some of these datasets have global/regional coverage. This data may need to be filtered or selected before using it in the project. The geospatial data can be filtered/selected attributes and/or geometries. Some of the software allow users to select the required data which allows one to create a subset of records in a layer or a table. The selection can also be interactive. The selected features can be exported as a separate layer for further use in a project.
7.1.1 Selection Tool
The selection tool of ArcGIS Pro offers several options for selecting features from the target layer. These selection tools allow selection of individual feature or group of features. The selected features can be exported as a separate layer. It is a quick and easy way of selecting features from the desired layer. The selected features can be cleared by clicking on the “clear features” tab. Similarly, the map can be zoomed to the selected features by clicking on the “zoom to selection” tab of the ribbon as shown in Figure 8.
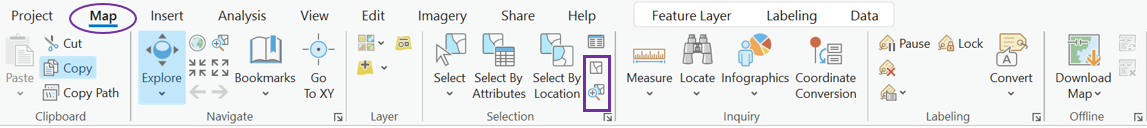
Figure 19: ArcGIS Pro Ribbon to access selection tools.
A Graphical User Interface (GUI) of selection tools of ArcGIS Pro is shown in Figure 18. These tools are useful for selection of single feature or multiple features of a layer on the go. It is a manual technique for selecting features and is useful for selection of few features. Other selection tools can be used when more features need to be selected.
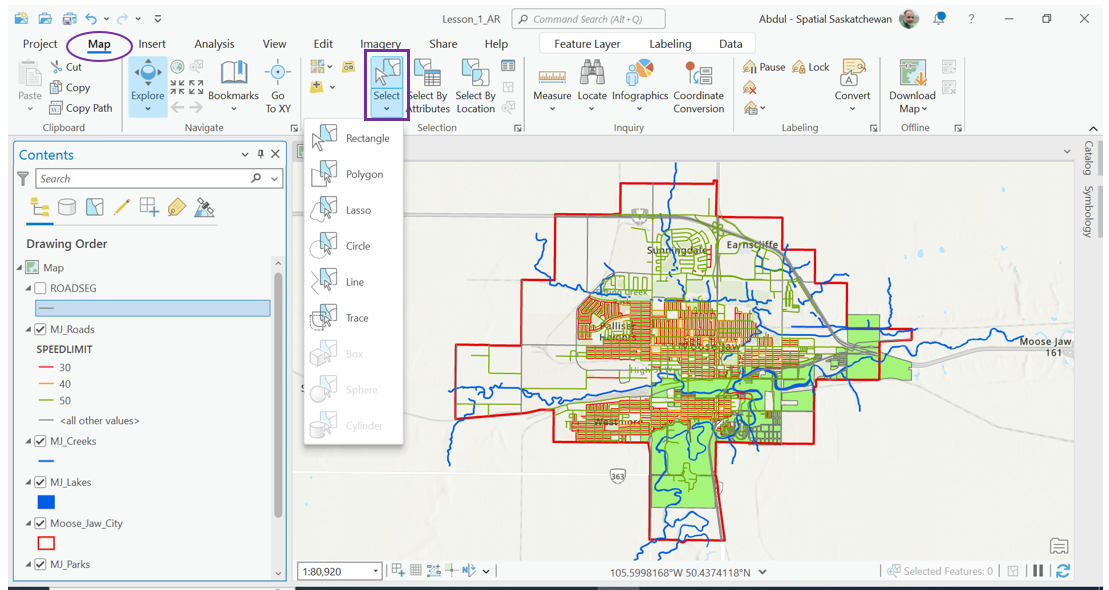
Figure 20: Some selection tools of ArcGIS Pro
7.1.2 Selection by Attribute
Selection by attribute is one of the commonly used feature selections from a layer or a table. It uses SQL query expressions to select desired features from a layer or a table. However, the SQL query expression is usually facilitated through a Graphical User Interface (GUI) which allows users to choose the targeted layer and a list of the layer’s attribute table fields. The fields will be listed in its original order. Some GUIs let the user choose the fields to be sorted and listed in either ascending or descending order. Different entries within the attribute table field can also be seen in a separate window of GUI. Possible query expressions are a part of GUI. This arrangement of GUI makes it easy to write and execute the SQL query. The selected features of the layer will be highlighted in the map. A separate layer can be generated from the selected features and/or can be exported and/or saved in the desired folder for later use. Selection by attributes toolbox of ArcGIS Pro is shown in Figure 19.
The tool allows users to set the attribute selection criteria. Only one selection criterion is shown in the figure; however, the tool allows users to set multiple selection conditions for attribute selection. As discussed earlier in chapter 5, a good knowledge and understanding of SQL is helpful to perform selection by attributes.
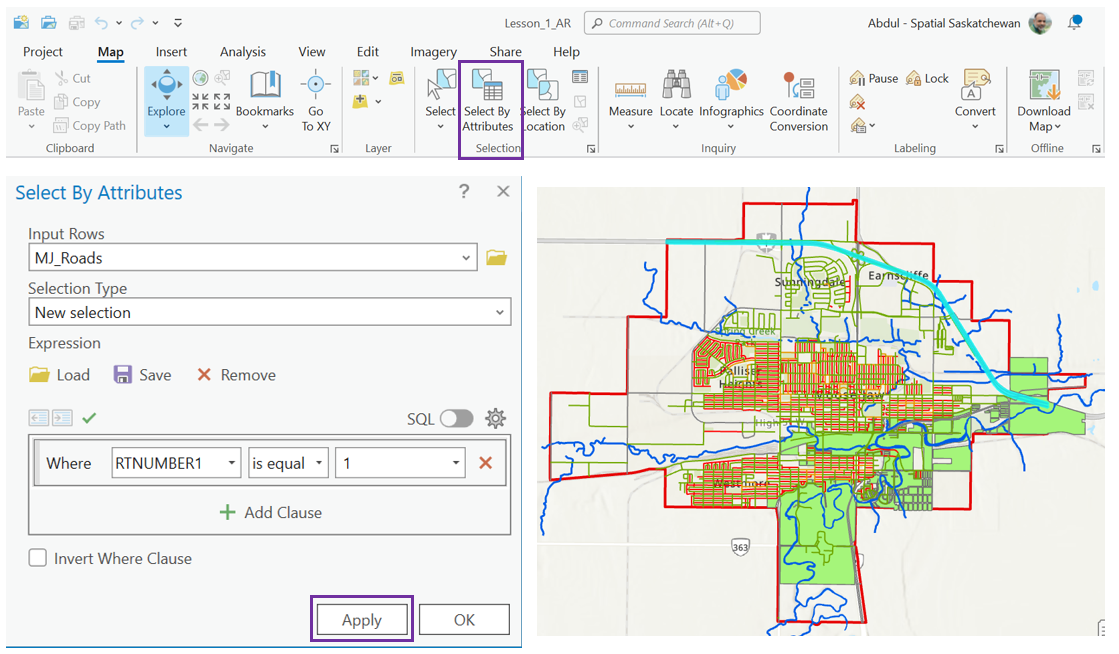
Figure 21: Selection by Attribute toolset of ArcGIS Pro
7.1.3 Selection by Location
Selection by location is another form of spatial query which selects features based on their relationship to features in another map layer. A map layer from which the features are to be selected is called “input features” or “target layer”, whereas the map layer used to define the boundaries of the features to be selected is called “selecting features” or “source layer”. A GUI to execute a spatial query allowing selection by location may also have a list of possible relations between the target and the source layers. The selection by location toolset of ArcGIS Pro is shown in Figure 20. The selected roads within Moose Jaw city using selection by location toolset are highlighted as shown in Figure 20.
This tool is particularly useful for selecting all the features within a specific geographic area or in its vicinity. Several relationship criteria are available within the tool and can be used for selection of the features. It is worthwhile to explore these criteria for appropriate and better selection of features.
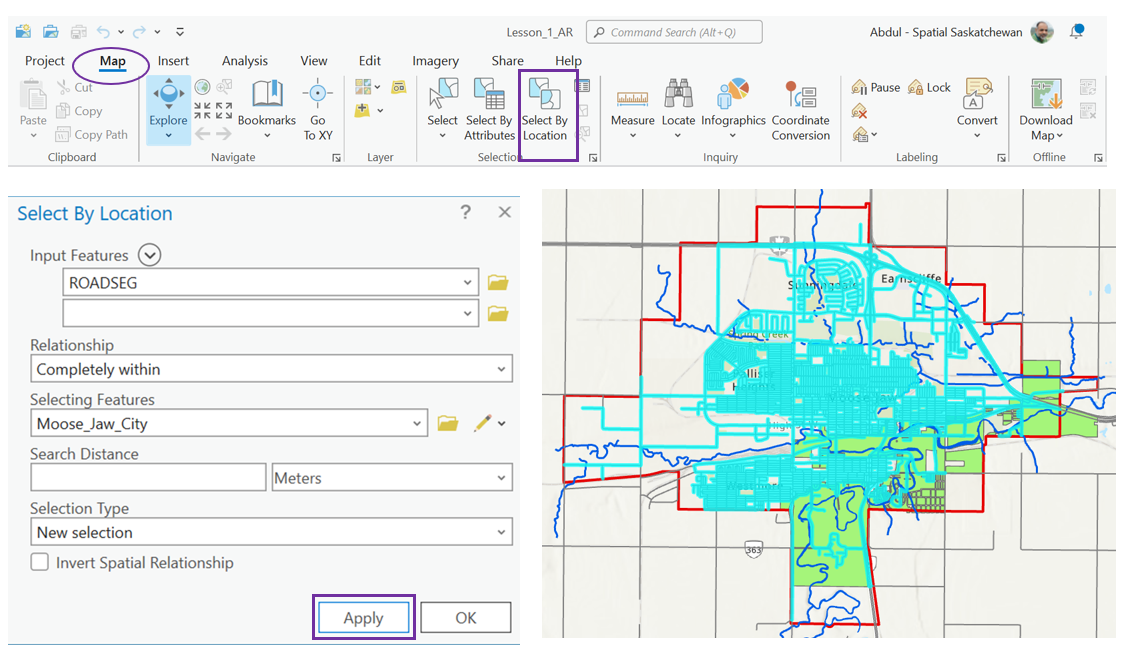
Figure 22: Selection by Location toolset of ArcGIS Pro
7.2 Geoprocessing
Geoprocessing is a process which allows spatial analysis and its modeling. A comprehensive set of tools is usually available in a GIS environment to perform geoprocessing tasks. Typically, these tools can be applied on a feature class (layer), raster, or a table to create output dataset. These tools are important and essential operations on geographic data and are commonly used in a GIS environment. Seven must-know geoprocessing tools are listed below:
- Buffer Tool
- Clip Tool
- Dissolve Tool
- Erase Tool
- Intersect Tool
- Merge Tool
- Union Tool
Buffer Tool
This tool creates a zone around a map feature and is one of the widely used geoprocessing tool in GIS environment. Both linear and geodetic units can be used to create a buffer. The tool also allows users to use more than one feature to create the buffer. These buffers can be dissolved to create one buffer in case the buffers are overlapping. Typical examples may include creating an exclusive area around roads also known as road allowance. Construction within a specific zone along high tension power wires or around oil wells is not allowed for safety reasons. This zone can be created using buffer tool. Steps to create a 200m road allowance around Highway 1 near Moose Jaw, Saskatchewan using ArcGIS Pro are shown in Figure 21. A blue colour zone around Highway 1 created using the buffer toolset is shown in Figure 21.
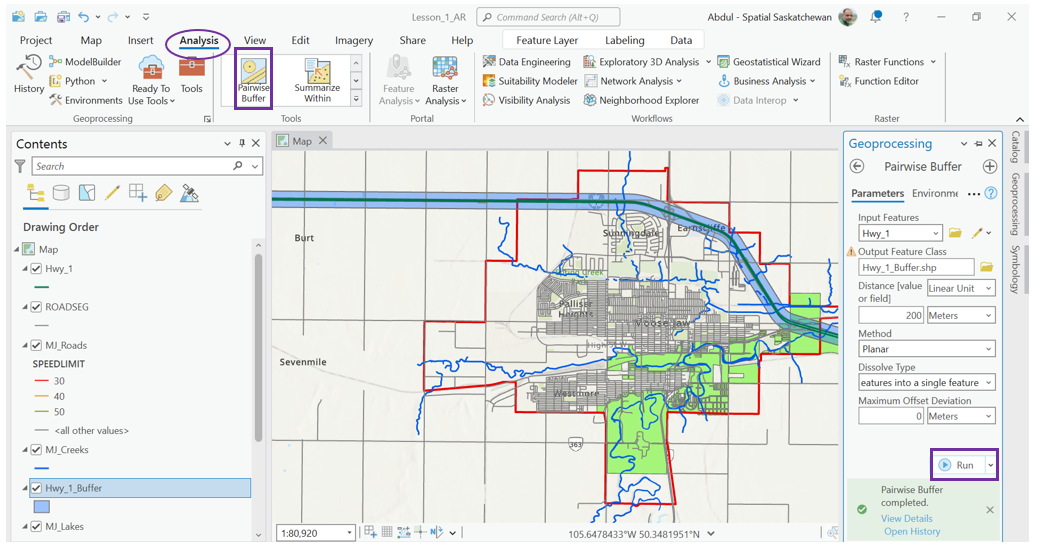
Figure 23: Buffer toolset of ArcGIS Pro
7.2.2 Clip
The clip tool uses an overlay function to cut the input layer to the extent of a defined feature boundary. This tool is used to extract a small portion of a bigger geo dataset. Smaller geo datasets require less storage space and are easy to work with. The tool works well for both vector and raster data. Satellite imageries usually cover larger areas, so the clip tool can be used for cutting the imagery to the project area. The larger geo datasets may overcrowd the maps, causing analysis difficulties. These larger datasets can be clipped to the desired project area. For example, the tool can be used to clip all the provincial roads using a specific city boundary so that the roads within the city boundary can be used in the geospatial analysis or to create a map of the city. Steps involved in clipping roads within Moose Jaw city using larger roads datasets using ArcGIS Pro are shown in Figure 22. The clipped roads are shown in purple.
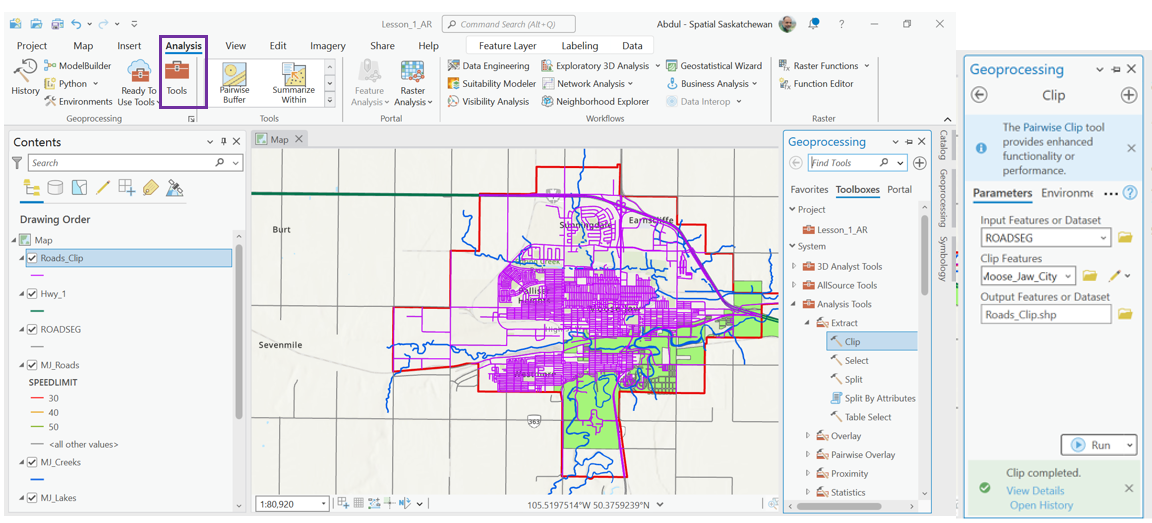
Figure 24: Clip toolset of ArcGIS Pro
7.2.3 Dissolve
The dissolve tool unifies boundaries in-between different features. The features must be neighbouring features so that they can be dissolved into one feature and the boundary in-between them is removed. A typical example of using the dissolve feature could be creating a map of a country without showing provincial boundaries. Moose Jaw city in Saskatchewan has two electoral constituencies. If required, these two constituencies can be dissolved to create one bigger area showing electoral area of Moose Jaw. The steps using dissolve tool in ArcGIS Pro are shown in Figure 23.
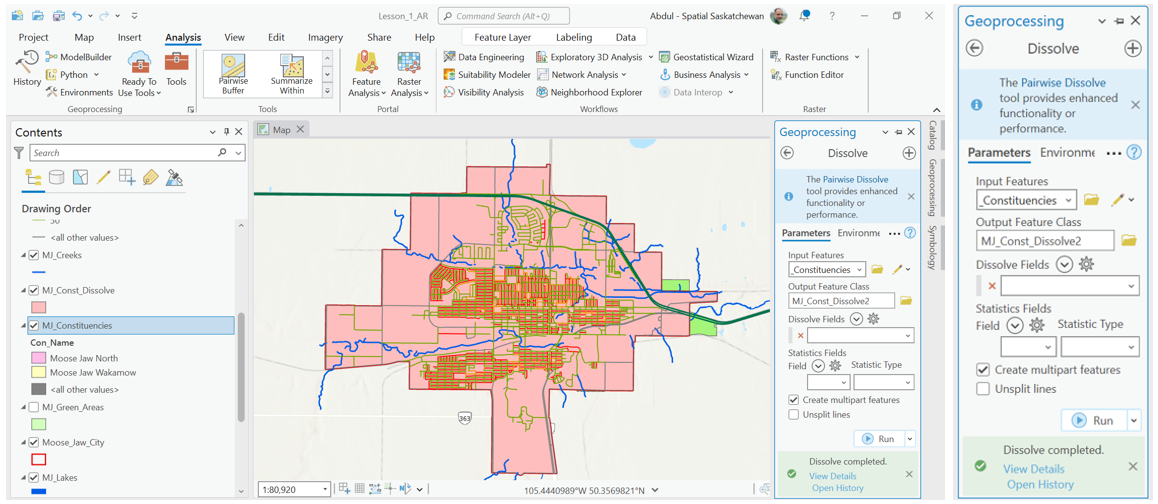
Figure 25: Dissolve toolset of ArcGIS Pro
7.2.4 Erase
The Erase tool removes features that overlap the erase features while maintaining the portion of input features falling outside the erase features extent. The result is a new feature with the erase feature extent removed. It is like subtracting overlapping area from the input feature class. Assume that an area of green spaces needs to be removed from the Moose Jaw city to calculate buildup area, the erase tool will be helpful. Steps to use erase tool using ArcGIS Pro are given in Figure 24.
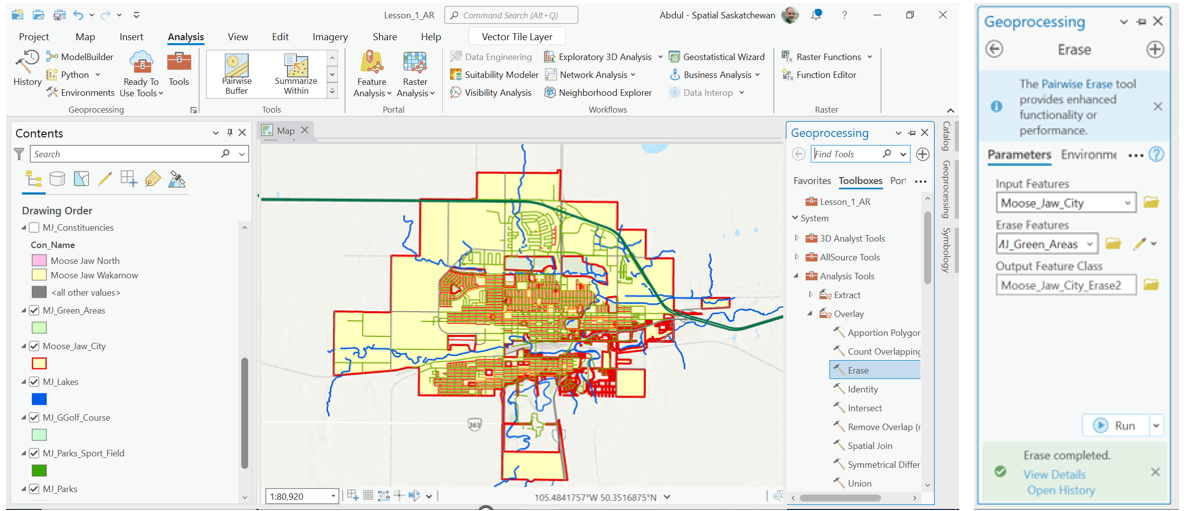
Figure 26: Erase toolset of ArcGIS Pro
7.2.5 Intersect
The intersect tool clips features which are overlapping the intersecting feature layers while preserving the attributes from all the data sets that overlap each other in the output. All the overlapping features will be part of the output dataset. It performs a geometric overlap of two or more datasets. A use of intersect tool for clipping the park within Moose Jaw city using ArcGIS Pro is demonstrated in Figure 25. The intersected area is shown in yellow.
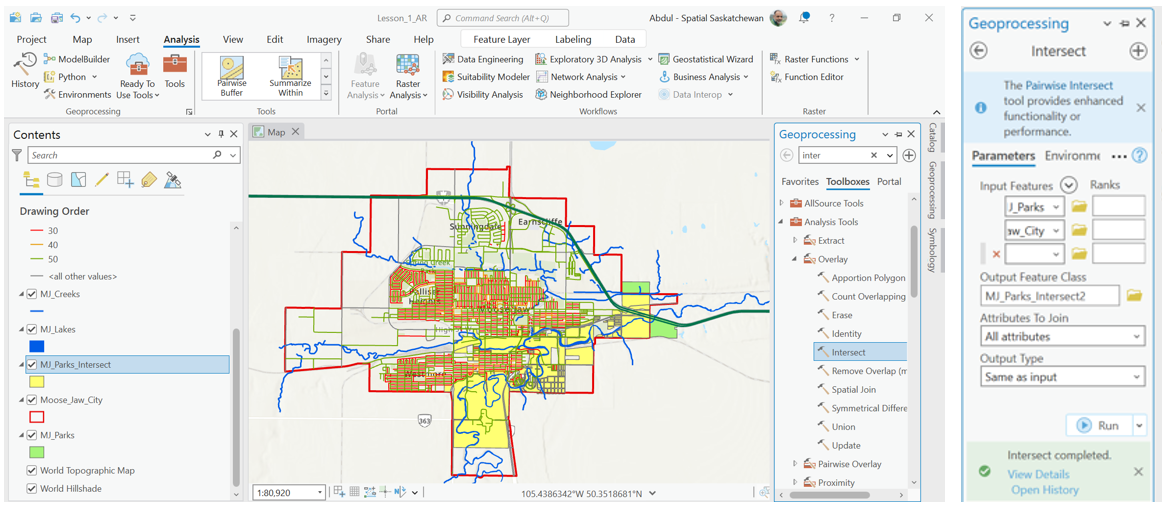
Figure 27: Intersect Toolset of ArcGIS Pro
7.2.6 Merge
The merge tool works like the union tool. It combines two or more datasets into one dataset. The only difference between the merge tool and the union tool is that the merge tool can also merge different features within the same layer whereas the union tool must combine two or more layers. The merging datasets must have the same data types. The tool can be used to merge all three types of vector datasets, i.e. point, line, or polygon. The merge tool will not split or alter geometries of the input datasets. Merging creeks layer and rivers layer of Moose Jaw city using ArcGIS Pro is demonstrated in Figure 26. The merged output will have both the creeks and the rivers in Moose Jaw.
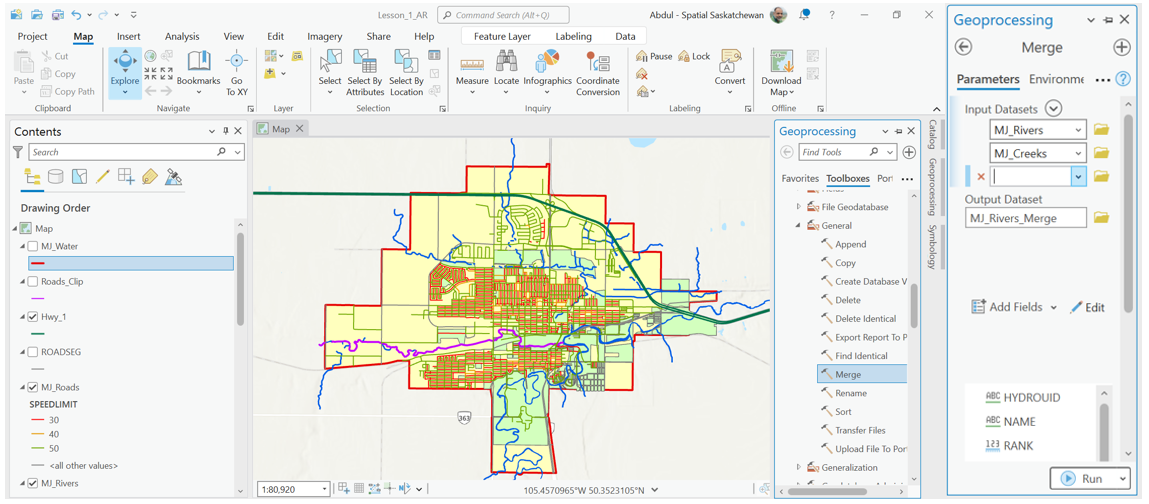
Figure 28: Merge Toolset of ArcGIS Pro
7.2.7 Union
The union tool combines two or more layers and creates a new layer combining the layers. However, the layer geometries must be the same. The steps involved in creating a layer showing all green spaces in Moose Jaw city using union tool is shown in Figure 27. The tool creates a new layer from the parks, fields, and a golf course layers of Moose Jaw city.
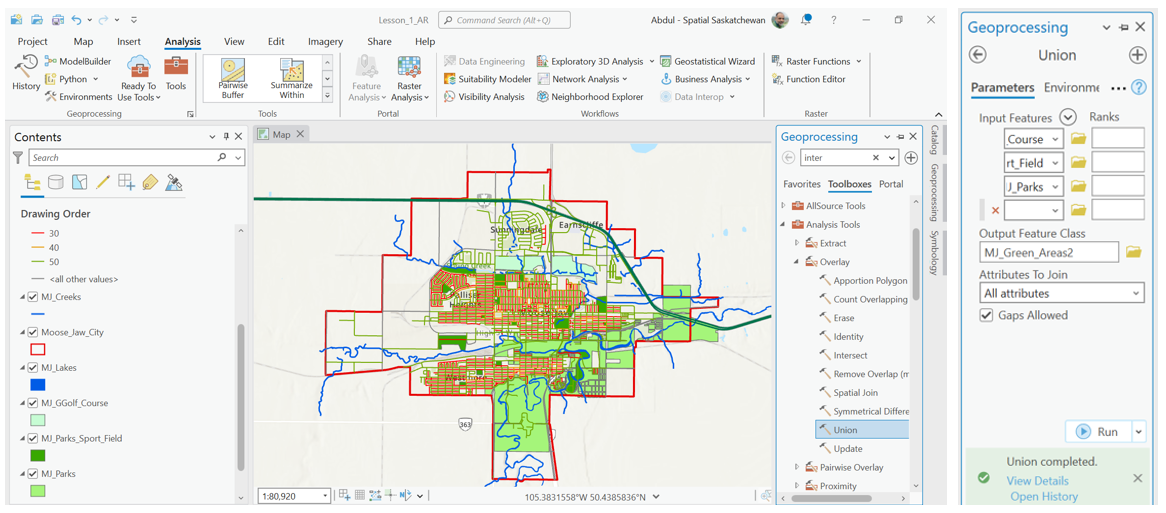
Figure 29: Union Toolset of ArcGIS Pro
7.3 Density Analysis
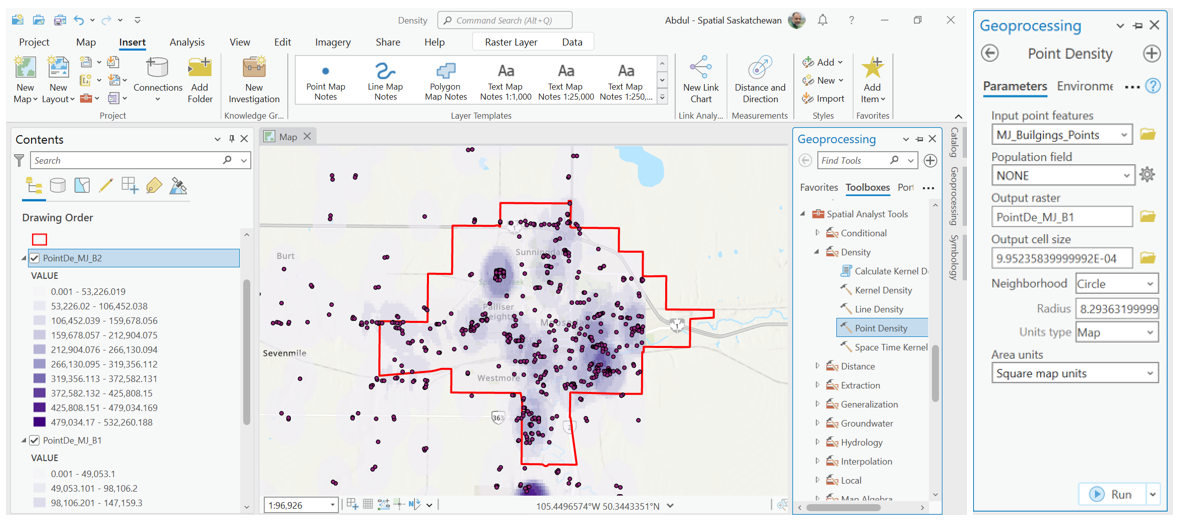
Density analysis indicates the concentration of points or lines in an area and provides valuable insight into natural and social phenomena. It can be useful in incidence analysis at a neighbourhood level. Density analysis is broadly divided into two types, i.e., simple density analysis and kernel density analysis. Simple density analysis is used to calculate number of points within a specific area using desired units of area such as square meter, without using any smoothing function. Kernel density analysis uses kernel function to smooth the output raster resulted from density analysis. Density analysis is embedded in the “Spatial Analysis” tools of ArcGIS Pro. Performing density analysis using ArcGIS Pro are illustrated in Figure 28.
Figure 30: Density Analysis using ArcGIS Pro
7.4 Cluster Analysis
Cluster analysis is a statistical technique to determine autocorrelation within the data. It organises the geospatial data into groups based on their association and value. It helps to identify similarities between the map features and identifies the existence of any patterns within the data. The methodologies can be used to determine the relationship between these clusters. The concentration of similar patterns or features having strong relationship are called hotspots, whereas the areas of weaker relationship are called cold spots. The cluster analysis is generally divided into two categories. The first categories count incidences without taking the weight of the incidence into account. It is like the density analysis. The second categories include the weight of the incidence while calculating the clusters and usually work with polygon features. The cluster analysis tools in ArcGIS Pro are grouped in the “Spatial Statistics” set of tools. Examples of using cluster analysis tools in ArcGIS Pro are shown in Figure 29. The buildings in Moose Jaw were used in the first example which shows eight different clusters. The number of 911 calls within a specific dissemination area (DA) of Moose Jaw were used in the second example. The DA polygons were divided in four different categories, i.e. HH, HL, LH and LL. HH are areas of high number of calls surrounded by other areas of higher number of calls. HL means areas of higher number of calls surrounded by low number of calls and so on.
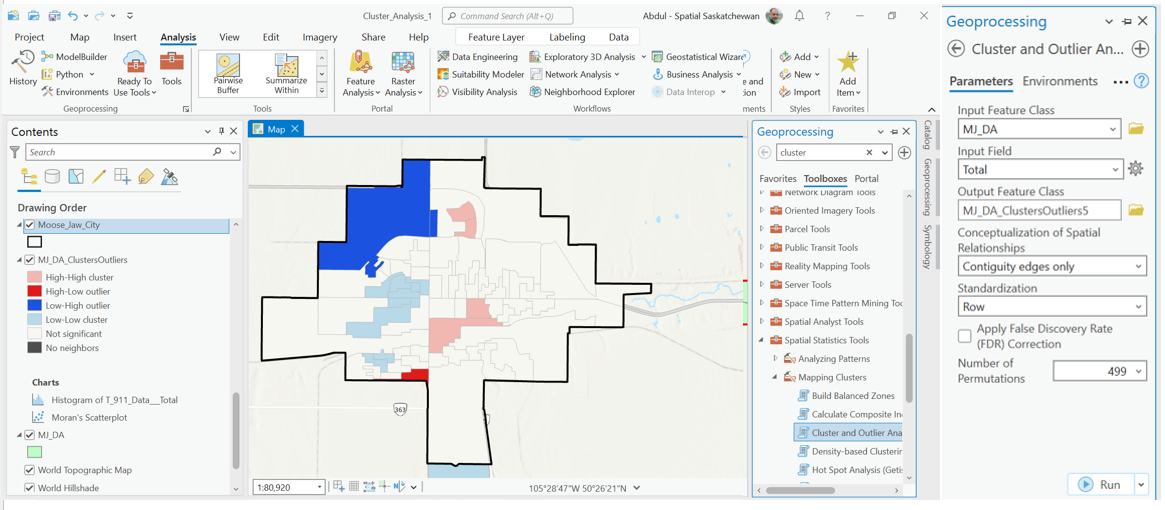
Figure 31: Clusters Analysis of 911 calls in Moose Jaw, using ArcGIS Pro
7.5 Hotspot Analysis
Hotspot analysis is like cluster analysis but only works with the point data. It determines the concentration of points within an area as compared with the random distribution of points. A hotspot can be defined as an area that has higher concentration of events compared to the expected number given a random distribution of events. The density of points within a defined area is compared within the area to determine hotspots. It also determines areas where events are randomly distributed. It helps to understand spatial patterns within the data. Hotspot analysis tools are a subset of “Spatial Analysis tools. An example of optimised hotspot analysis using ArGIS Pro is shown in Figure 30.
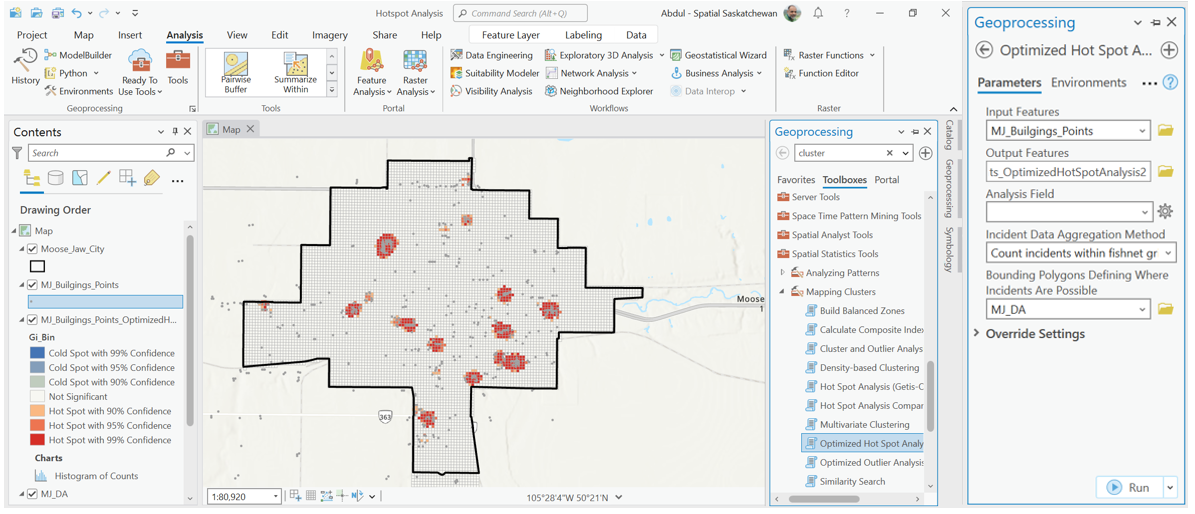
Figure 32: Hotspot Analysis of commercial buildings in Moose Jaw using ArcGIS Pro
7.6 Data Interpolation Techniques
Spatial interpolation is the statistical technique of estimating values at unsampled points using the values at sampled points. Interpolation is one of the commonly used techniques in GIS environment and has a wide variety of applications in both natural and social science. Typical applications may include developing Digital Elevation Model (DEM), understanding a climatic phenomenon, determining soil properties, etc. Data is usually collected at different irregular locations and modeled using interpolation techniques to create a raster surface. The basic role of spatial interpolation is to estimate the values at locations where data is not available. There are several interpolation techniques which can be used for estimating unknown values within the specific area. All interpolation techniques have its own advantages and disadvantages. Many of these techniques are available in ArcGIS Pro. Spatial interpolation tools are a subset of “Spatial Analyst” tool of ArcGIS Pro. Estimating rainfall distribution using data collected by weather station using ArcGIS Pro is demonstrated in Figure 31.
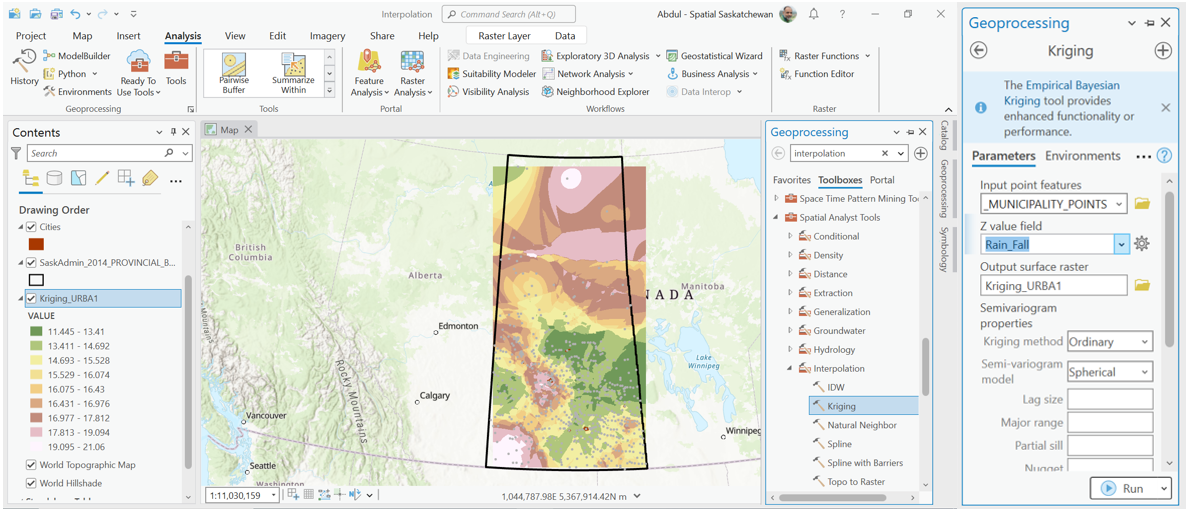
Figure 33: Rainfall estimation using interpolation techniques in ArcGIS Pro
