Chapter 3: An Introduction to Geographic Information System (GIS)
Geospatial data, or geodata, is data that includes information related to a specific location on the surface of the Earth and can provide information about events, features, and phenomena to a specific geographical area identified by map coordinates (Simmons, 2018). It can also combine location and temporal information. Geographic Information System (GIS) is a tool, or a multi-component system used to create, record, manage, display/visualize, and analyze geospatial data. It can support some analytical processes while facilitating decision making. It can also be defined as the science of who, what, where, whom and how. In other words, it is a digital map with a geospatial database attached to it. This spatial database helps to transform data into information through a series of user-defined queries and processes. The data is displayed in the form of map layers stacked on top of each other. Thus, GIS provides the flexibility of adding or removing data as per user requirements. Geospatial analysis is the backbone of GIS though it also facilitates statistical analysis, cluster analysis, temporal analysis, network analysis, quantitative analysis, and many more. Thus, GIS has its applications in almost all walks of life wherever location plays an important role (Simmons, 2018).
3.1 History and Evolution of GIS
The concept of geospatial analysis using maps is dated back to 1854 with the cholera outbreak in the city of London, England when Dr. John Snow, a British physician, started mapping outbreak locations, roads, property boundaries, and water supply lines. Through his analysis, he discovered that the water of a well associated with the water pump on the Broad Street was contaminated and has caused the cholera outbreak (Frerichs, 2022). The water pump is still preserved as a historic monument. Dr. John Snow is considered as a father of Epidemiology and Geospatial Analysis. GIS started with map making and Geospatial Analysis. Thus Dr. Snow is also considered as the father of GIS. However, digital mapping did not exist till 1960s and the maps were hand-drawn, and the layering concept of GIS was achieved through maps drawn on transparencies and stacking them on a light table to identify overlapping areas. It was referred to as sieve mapping.
The advancements of computer technologies in 1960s allowed geographers to create digital maps. Roger Tomlinson developed the first computer-based Canadian Geographic System (CGIS) in 1963 and is considered as the first computer-based geographic information system of the world (GISGeography, 2022). Soon after that, the other countries around the world, including USA and UK, also started developing their digital maps using GIS. Increased popularity and demand of digital maps led to the development of commercial GIS software. Many commercial GIS software is available today for users to cater to their needs. However, availability of topographic and geospatial data remained a challenge for GIS professionals as countries and national security agencies were concerned about the sensitivity of such data. Commercialization of satellite remote sensing in 1980s and onward opened new dimensions of data acquisition and integration. Both raster and vector data were commonly used in GIS. Early 1990s saw exponential growth of GIS applications as policymakers started realizing the importance of geospatial analysis in decision making. The data restrictions gradually started lifting after 2010. Open-source data and software became the theme of the time. Several national and international organizations including the United States Geological Survey (USGS) started offering free data downloads of satellite and other geospatial data. Professionals started developing open-source GIS software and GIS became affordable for individuals and small enterprises. GIS has entered an era where it has become an integral component of many developmental and sustainability projects. It is referred to as the “user adaptation” era of GIS. Thousands of research papers are published annually and presented in conferences all over the world. It can be said that within last few decades, GIS has evolved from concept to science. The evolution of GIS resulted in different connotations of the “S” of GIS. It is usually referred to as five “S” of GIS.
GIS: Geographic Information System.
GIS: Geographic Information Software.
GIS: Geographic Information Studies.
GIS: Geographic Information Science.
GIS: Geographic Information Services.
3.2 Map Layers and Base Map
One of the advantages of GIS includes its ability to display geospatial information in the form of map layers. Each layer must contain the same geometry and only one type of features. The road layer must have a polyline geometry and should only contain different types of roads. Though technically possible, it should not contain any other type of linear features. Similarly, a layer containing parks may have polygon geometry and should only contain different types of parks. However, a layer with point geometry may have location of different types of features, e.g., hospitals, businesses, and other points of interests. These layers can be stacked on top of each other, and the user has the flexibility to add or remove layers as needed. The layer order can also be chosen by the GIS professional. However, one must be careful in selecting the layer order as it can mislead the map readers. For example, if the road layer is placed under the river layer, the road may not be visible while passing over the river and thus, can cause confusion whether there is a bridge over the river or not. The problem can be resolved by placing the road layer over the river layer. Similarly, if a layer with polygon geometry can mask or hide point or linear features when placed on top of layer with a point geometry or a polyline geometry. A typically suggested layer order may be point layer, polyline layer, and polygons layer. Though layer transparency can be set by the user, it is suggested that a layer containing smaller polygons must be placed on top of layers containing larger polygons, e.g, city polygons on top of provincial polygon. User can assign desired colour to each layer or different colours to features within a layer. A good knowledge of colour theory may help users to create better maps. A better colour scheme may also help important features stand out. However, it is advisable to choose natural colours to represent natural features, such as blue for water and green for vegetation.
Some GIS software allow users to add basemaps to the project as a layer which can act as a fundamental block to the project. These are ready-to-use maps for user applications. The user can choose one of the several available base maps. Some of the freely available base maps may include orthophoto, satellite imagery, topographic, digital elevation model, and elevation contours. Some of these base maps also have attached labels or annotations to facilitate understanding. Esri provides a wide list of freely available online maps in more than 40 languages which can depict local and/or international geographies.
3.3 Attribute Tables
An associated data table with each layer of the map is a unique advantage of GIS. This data table is called an attribute table of the layer and contains information of all features of the layer in a tabular form. An attribute table is arranged in a way that each row of the table represents a layer feature, and each column represents one of its attributes. However, in the layer containing a raster dataset, each layer will represent a certain zone of cells having the same value. The rows of an attribute table are called records, and the columns are termed as fields. The fields of an attribute table can be used to generate queries to select specific records or features within the layer. Thus, an attribute table is like a database table attached with a specific layer of the map and can be joined or relate with external tables. Each attribute table have a specific field representing unique identification number for each record within the table. Each field of the table can only store one data type, i.e., number, integer, text, date, etc. A field can be added or deleted from the table, but its data type must be declared before adding it to the table. An attribute table window may have different components to facilitate table management as shown in Figure 10.
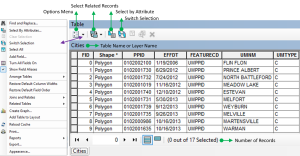
Figure 11: An attribute table window showing an attribute table and some functions.
It can be seen in the option menu that attribute tables can be exported as “*.CSV” file. Graphs can also be generated from the attribute table. Statistics of a desired field can be calculated by right clicking on the field header and selecting “statistics”. Similarly, geometry of a feature can also be calculated by adding a new field, setting its data format to double, right clicking on its header, and selecting “calculate geometry”. It allows user to calculate the polygon area, its circumference, or length of a linear feature using desired units.
3.4 Metadata
Metadata is a document produced and maintained by GIS data generators to provide information about the data they are producing, maintaining, or hosting. It contains information about data structure, attribute table fields, type of data, and meanings of abbreviations used in the data. Analysis or classification of GIS data may cause some confusion without this information. Sources of data and its accuracies are also declared in the metadata. Thus, metadata helps users to understand data details so that they can properly use it, which can be achieved through four roles:
- Availability: To determine geospatial data viability for a specific location or area.
- Fitness for Use: Data need to be evaluated for its suitability for the specific use.
- Access: The required data need to be acquired if available.
- Transfer: Data need to be processed and integrated into GIS projects
Different countries or organizations may have their own metadata standards. Federal Geographic Data Committee (FGDC) of USA has prepared a document providing technical guidance for national geospatial data assets which can be downloaded in PDF format from their website at: https://www.fgdc.gov/technical-guidance/metadata/fgdc-technical-guidance-datagov-geoplatform-ngda.pdf. The CSDGM suggested the following seven sections for metadata. Since its inception, the CSDGM has been adopted by various government and non-governmental organizations around the world. International Standard Organization (ISO) has developed different standards for metadata and can be followed while developing metadata (ISO, 2014).
ISO 19115-1: For documentation of GIS vector and point data and geospatial data services such as web-mapping applications, data catalogs, and data modeling applications.
ISO 19115-2: For extension adds elements to describe imagery and gridded data as well as data collected using instruments, e.g., monitoring stations and measurement devices.
ISO 19110: For document feature catalogs (entity/attributes) and can be referenced or incorporated into a 19115-1 record.
North American Profile (NAP) of ISO-19115 is expected to replace CSDGM. It may not include the same level of details as CSDGM but does provide mandatory elements such as Data Identification and Metadata Reference Information.
Open Geospatial Consortium (OGC) Standards conforms to the FAIR (Findable, Accessible, Interoperable, and Reusable) concepts of geospatial information. The OGC Standards have been used by thousands of organizations across the globe to ensure interoperability and maximize the value of their geospatial data. The OGC Standards provide the stable platform upon which geospatial innovation is built (OGC, 2024). The consortium also offers free learning resources.
3.4.1 Data Identification (Mandatory Section)
It is usually the first section of metadata which describes the basic information about the data including data title, geographic location or area of the data, keywords associated with the data, and rules for acquiring or using the data including pricing if any. It may include the postal address, email, and telephone number of the data provider agency. The identification may also include abstract, purpose and supplemental information, date of data acquisition, information about data updates, its access or use constraints. Data credits and citation information are also provided in the data identification section.
3.4.2 Data Quality (Mandatory Section if Applicable)
The data quality section of the metadata contains data accuracy information including its completeness, logical consistency, positional and attribute accuracy. The data collection/processing steps and their effects on the data accuracies are also included in this section. Cartographic scale or the data acquisition scale determine the zooming extent of the data. The zooming extent determines the scale beyond which data was not collected.
3.4.3 Data Organization (Mandatory Section if Applicable)
This section contains information on the type of data and how it is organized. Some GIS software allow the flexibility to fill this section of the metadata automatically. This section specifies that whether the data is in vector format or a raster data. If it is in vector format, the geometry of the data is point, polyline, or a polygon. This section also specifies if linear referencing of the features is enabled or not, and if the data has been rectified for topological errors and topological relationships have been established.
3.4.4 Data Spatial References
This section of the metadata contains information about the ground control points of the data, datum, and projection system used for the geospatial data. Some GIS software allow the flexibility to fill this section of the metadata automatically. The information provided in this section is required for proper registration of the data with other geospatial data used in the project. All the data used in any GIS project should have the same datum and projection system for proper registration. Most GIS software can transform the datum and projection system on the fly or have tools available for such transformation.
3.4.5 Data Entities and Attributes
This section of the metadata contains information about all the attribute fields within the data including data type, codes, and abbreviations used. This information is useful for data analysis and classification which may not be possible without this information. The section starts with a brief description of the attribute fields which may be self-explanatory. Detailed description is provided to the attribute fields involving codes and abbreviations. Meanings of each code and abbreviations are provided in the metadata.
3.4.6 Data Distribution Information
GIS users need to acquire required geospatial data to fulfill the project needs. The data distribution section of metadata provides information about the data distributor or seller, data distribution format (DVD, USB, FTP, and web tools etc.), data cost, and any restriction for the use of the data. Time required by the distributor to prepare the data including possible delivery time is also included in this section.
3.4.7 Metadata References
The last section of the metadata includes detailed information of the distributor including the name, telephone number, and email address of the contact person. The language used in the metadata and stranders following to create the metadata is also specified in this section.
3.5 Open Data Sources
A massive amount of GIS data is generated by GIS professionals, government and non-government organizations, and academic institutes on daily basis. Geospatial data may have sensitive information and, for that reason, has been restricted up until recently. Open-source data has become a new theme for GIS professionals. The government of Canada and some other organizations around the world have started declassification of the data and now adopting open-source policies for some of the geospatial data. Some of the open data sources are listed below which can be used to download geospatial data for free.
3.5.1 Government of Canada Open Data Portal
A central location for a variety of open data products. It includes data from several Canadian Government departments. The website can be accessed at: https://open.canada.ca/en/open-data
Government of Saskatchewan Open data portalshttps://geohub.saskatchewan.ca/. Saskatchewan GeoHub- consists of Highways, Environment, Energy and Resources geospatial data.
3.5.2 Geospatial Data Extraction Tool
A mapping application that allows users to select an area using geometric tools and download some geospatial data including Digital Elevation Model (DEM). The geospatial data extraction tool can be accessed at: https://maps.canada.ca/czs/index-en.html
3.5.3 GeoGratis
Provides a variety of geospatial information and data. The website can be accessed at: https://geogratis.gc.ca/
3.5.4 ISC
ISC provides registry and information management services for public data and records. The crown corporation provides different GIS data products. Some of the geospatial data can be downloaded free of cost. The website can be accessed at: https://www.isc.ca/mapsandphotos/gisdata/pages/default.aspx
3.5.5 Earth Explorer
Managed by United States Geological Survey (USGS). It provides a variety of satellite data products and other topographic data free of charge. The website can be accessed at: https://earthexplorer.usgs.gov/
Media Attributions
- Picture1
